FINANCIAL DATA (CONSOLIDATED)
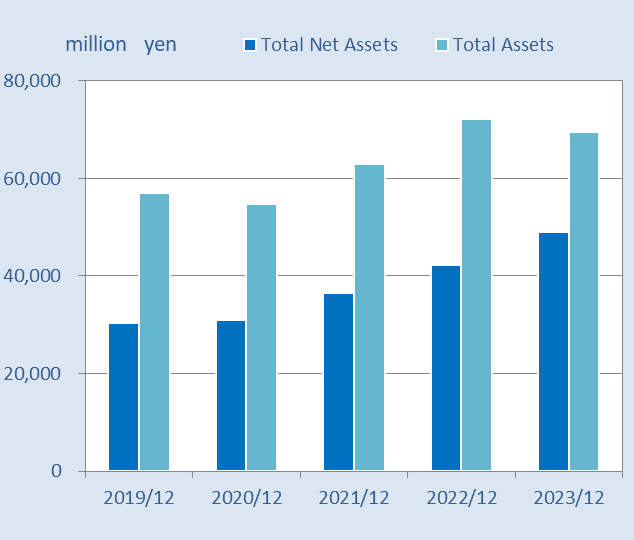
Total Net Assets / Total Assets
| 2010/3 |
2011/3 |
2012/3 |
2013/3 |
2014/3 |
2015/3 |
2016/3 |
2017/03 |
2017/12 |
2018/12 |
2019/12 |
2020/12 |
2021/12 |
2022/12 |
2023/12 |
| 17,836 |
21,381 |
24,190 |
21,306 |
21,668 |
21,303 |
22,731 |
18,812 |
17,961 |
21,739 |
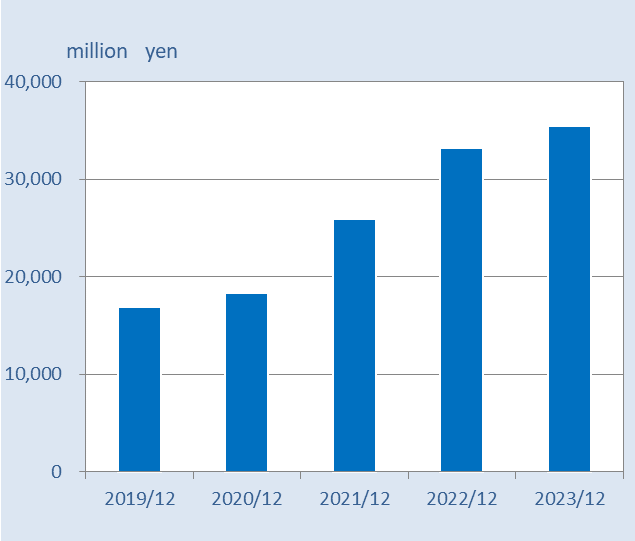
16,908 |
18,339 |
25,942 |
33,212 |
35,403 |
| 2,892 |
5,181 |
2,710 |
△42 |
837 |
1,329 |
2,783 |
2,334 |
1,878 |
1,670 |
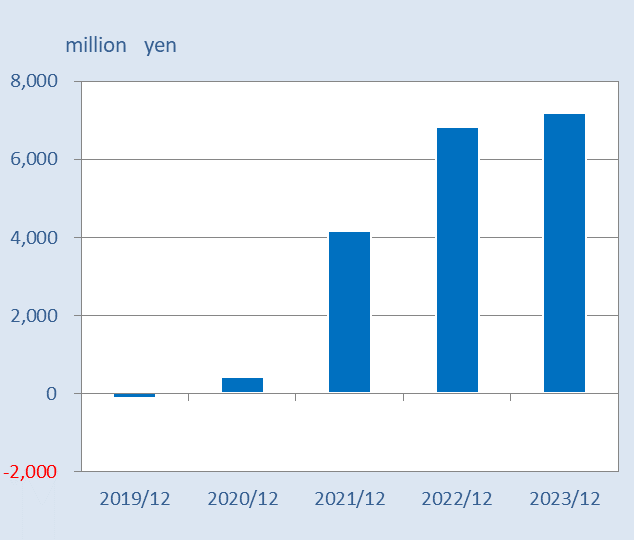
△110 |
429 |
4,161 |
6,839 |
7,188 |
| 2,585 |
4,835 |
2,402 |
101 |
783 |
1,306 |
2,555 |
2,539 |
1,790 |
1,539 |
△393 |
161 |
4,086 |
7,345 |
7,411 |
| 2,231 |
4,151 |
△5,529 |
500 |
61 |
△477 |
465 |
1,242 |
334 |
1,038 |
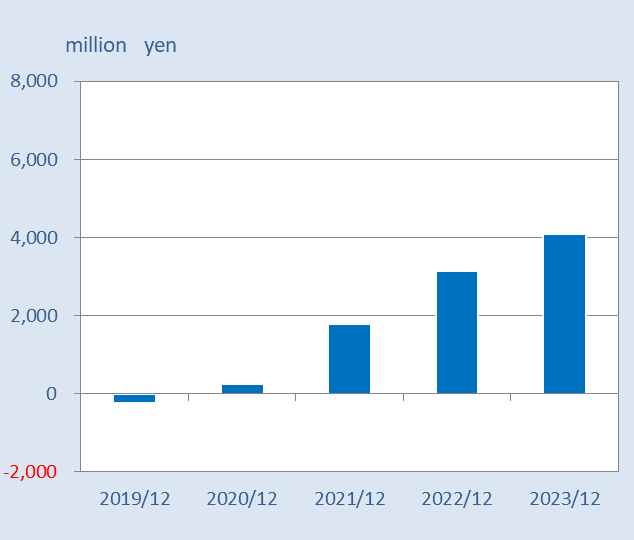
△243 |
238 |
1,793 |
3,134 |
4,094 |
| 17,661 |
26,557 |
21,198 |
22,237 |
22,671 |
23,591 |
23,653 |
27,221 |
29,164 |
30,914 |
30,250 |
31,036 |
36,560 |
42,206 |
49,006 |
| 32,739 |
50,325 |
41,088 |
35,542 |
33,514 |
35,324 |
35,834 |
46,317 |
54,221 |
62,799 |
56,927 |
54,740 |
62,966 |
72,262 |
69,438 |
| 21,278.86 |
2,681.80 |
2,084.25 |
2,165.57 |
2,185.93 |
2,193.96 |
2,200.08 |
2,366.55 |
2,426.41 |
2,501.40 |
2,518.48 |
2,555.68 |
2,878.81 |
3,251.39 |
3,750.86 |
| 2,905.32 |
509.44 |
△595.74 |
53.87 |
6.59 |
△51.42 |
50.19 |
133.90 |
36.05 |
111.89 |
△26.66 |
26.23 |
197.19 |
344.56 |
450.11 |
| 49.9 |
49.5 |
47.1 |
56.6 |
60.5 |
57.7 |
57.0 |
47.4 |
41.5 |
37.0 |
40.2 |
42.5 |
41.6 |
40.9 |
49.1 |
| 9,327 |
10,382 |
9,813 |
7,543 |
8,178 |
6,238 |
6,616 |
6,478 |
6,870 |
8,529 |
5,872 |
9,696 |
11,424 |
17,031 |
18,331 |
| △807 |
△8,503 |
△10,671 |
△2,896 |
△3,653 |
△6,597 |
△7,091 |
△11,765 |
△12,065 |
△13,748 |
△4,797 |
△5,364 |
△9,652 |
△12,191 |
△14,663 |
| △7,469 |
2,532 |
△804 |
△4,260 |
△2,757 |
△783 |
772 |
7,602 |
4,503 |
7,138 |
△3,166 |
△2,979 |
△2,007 |
△382 |
△9,615 |
| 2,820 |
7,211 |
5,557 |
6,043 |
7,882 |
6,880 |
7,073 |
9,542 |
8,910 |
10,722 |
8,628 |
10,007 |
10,124 |
14,591 |
9,096 |